Question #6430242Single Choice
Physics
Question
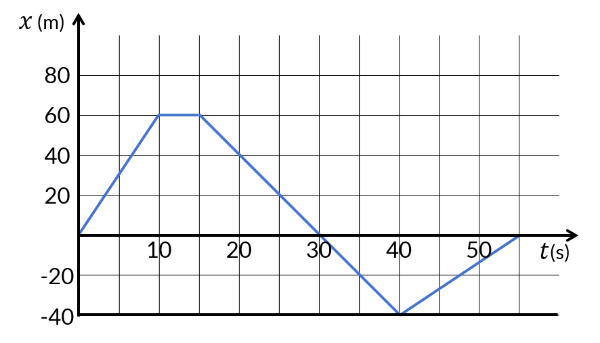
For the position-time graph shown, during which time interval did the object maintain its greatest speed?
Options
A
0-10 s
B
10-15 s
C
15-40 s
D
40-55 s
For the position-time graph shown, during which time interval did the object maintain its greatest speed?