Analyze a-t graph
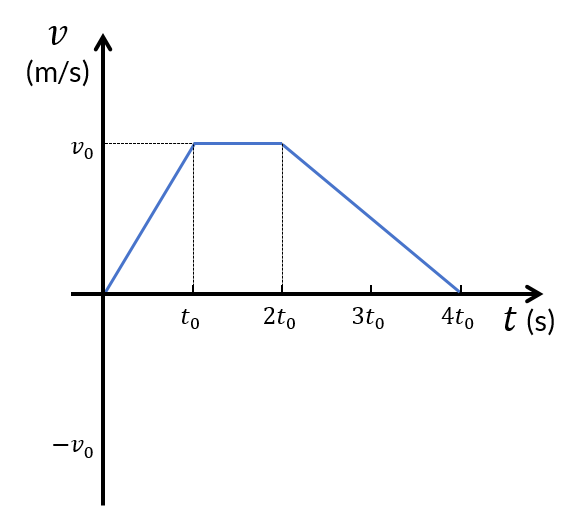
From to :
The acceleration is (constant).
So the velocity increases linearly with time from to . The slope
of the graph in this interval is (positive).
From to :
The acceleration . When , the
velocity remains constant. So the graph is a horizontal line in the
interval with the velocity at ).
From to :
The acceleration (constant). The
velocity decreases linearly with a slope of (negative).
Then, analyze each v-t graph:
Option A
The velocity starts from 0, increases
linearly to in the first seconds, which is incorrect as the
acceleration is positive in the first seconds, so the slope should be
positive.
Option B
The velocity starts at and decreases
to in the first seconds. So, the behavior of the graph does not match
the description based on the graph.
Option C
The velocity starts from , increases
linearly to