Question #6428343Single Choice
Biology
Question
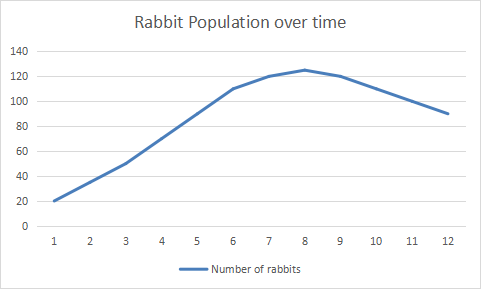
What conclusion can you draw from this graph?
Options
A
The rabbit population increased steadily, then began to decrease.
B
The rabbit population remained constant over time.
C
The rabbit population decreased from the start.
D
The rabbit population grew and then stayed at the same level.
Answer & Analysis
Click "Show Answer" to reveal the answer and analysis
Want More Practice Questions?
Access thousands of practice questions with detailed explanations on Scholardog.
Practice Now - It's Free!