Question #6428320Single Choice
Biology
Question
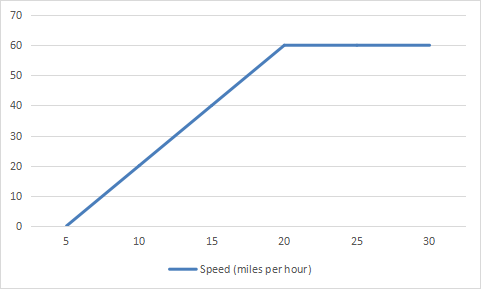
The graph shows the speed of a car over time.
What is happening in the graph between 20 and 30 minutes?
Options
A
The car is accelerating.
B
The car is not moving.
C
The car is decelerating.
D
The car is travelling at a constant speed.
Answer & Analysis
Click "Show Answer" to reveal the answer and analysis
Want More Practice Questions?
Access thousands of practice questions with detailed explanations on Scholardog.
Practice Now - It's Free!