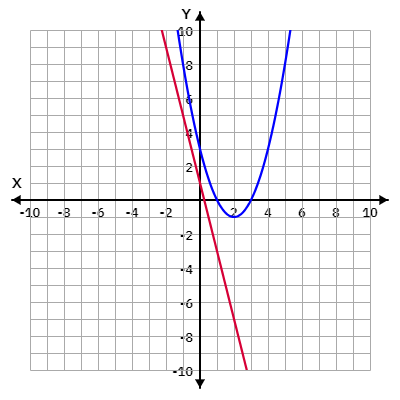
Which of the following graphs correctly represents:
Step 1: Find the points of intersection
To find the points of intersection between the parabola and the line, set the equations equal to each other:
Rearranging the terms:
This is a quadratic equation. We can calculate its discriminant ( ) to check for real solutions (i.e., intersection points).
Click "Show Answer" to reveal the answer and analysis
Access thousands of practice questions with detailed explanations on Scholardog.