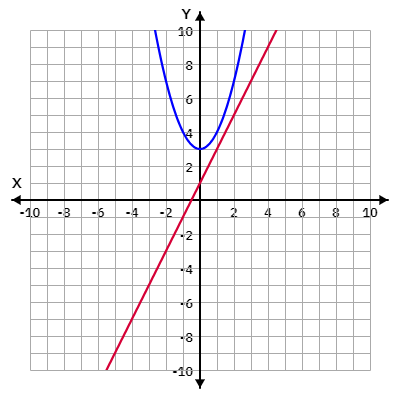
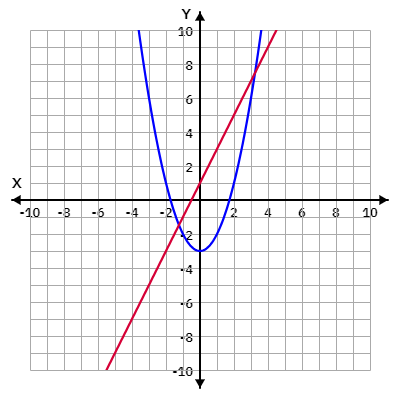
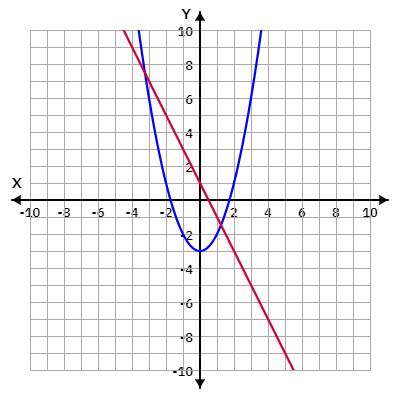
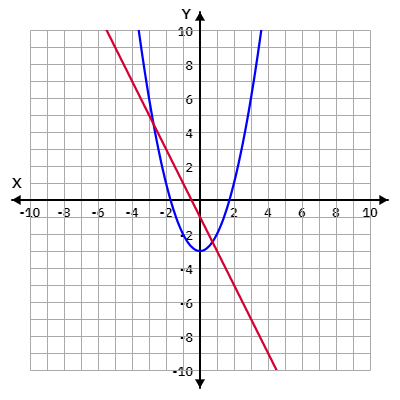
Which of the following graphs correctly represents:
Step 1: Set the two equations equal to each other.
To find the points of intersection, set the two equations equal to each other:
Step 2: Rearrange the equation.
Move all terms to one side of the equation:
Step 3: Use the discriminant to determine the number of solutions.
For any quadratic equation of the form , the discriminant is given by:
Click "Show Answer" to reveal the answer and analysis
Access thousands of practice questions with detailed explanations on Scholardog.