Which of the following graphs is most likely the graph of the function ?
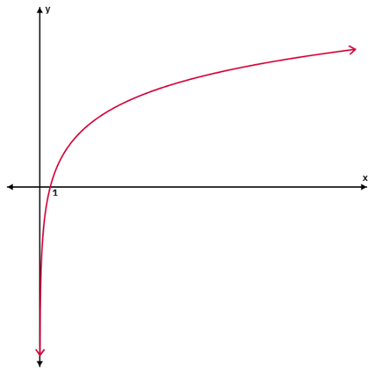
Option A is most likely the graph of the function .
The function is an increasing function for x>0 because the coefficient 5 is positive and the base 2 for the logarithm is greater than 1.
When , . So, the x-intercept is at the point (1, 0).
As x approaches 0, Click "Show Answer" to reveal the answer and analysis
Click "Show Answer" to reveal the answer and analysis
Access thousands of practice questions with detailed explanations on Scholardog.