Question #6421622Single Choice
Algebra-1
Question
A scatter plot is constructed to analyze the relationship between the number of hours a student spends on social media per day (x) and their grade point average (y) over a semester. The data points are as follows:
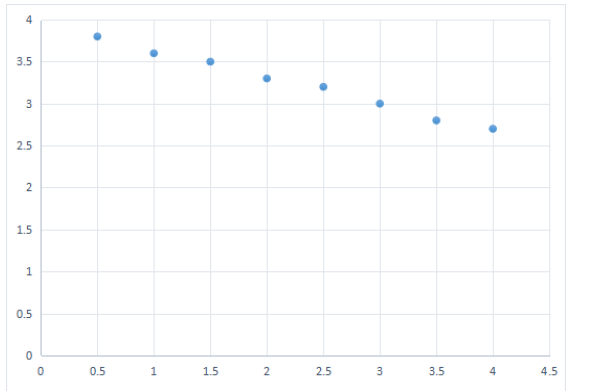
The scatter plot of this data shows a:
Options
A
Positive correlation
B
Negative correlation
C
Zero correlation
D
Non-linear correlation
Answer & Analysis
Click "Show Answer" to reveal the answer and analysis
Want More Practice Questions?
Access thousands of practice questions with detailed explanations on Scholardog.
Practice Now - It's Free!