Question #6421618Single Choice
Algebra-1
Question
Data regarding the number of new businesses opening in a town (x) and the unemployment rate (y) is given:
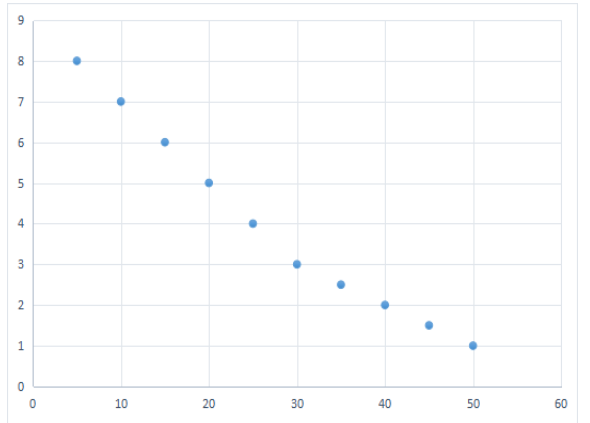
The scatter plot of this data indicates:
Options
A
Positive correlation
B
Negative correlation
C
Zero correlation
D
Non-linear correlation
Answer & Analysis
Click "Show Answer" to reveal the answer and analysis
Want More Practice Questions?
Access thousands of practice questions with detailed explanations on Scholardog.
Practice Now - It's Free!