Question #6421606Single Choice
Algebra-1
Question
Data about the daily average temperature (x in degrees Fahrenheit) and the number of ice cream cones sold (y) at a local shop is as follows:
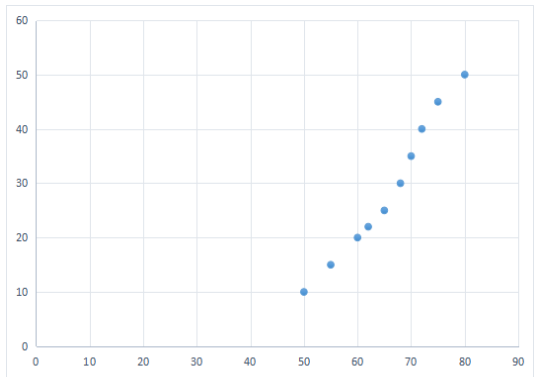
What kind of correlation would the scatter plot of this data exhibit?
Options
A
Positive correlation
B
Negative correlation
C
No correlation
D
Weak positive correlation
Answer & Analysis
Click "Show Answer" to reveal the answer and analysis
Want More Practice Questions?
Access thousands of practice questions with detailed explanations on Scholardog.
Practice Now - It's Free!