Question #6421604Single Choice
Algebra-1
Question
The following data shows the relationship between the number of advertising campaigns (x) and the corresponding increase in product sales (y) over a period of time.
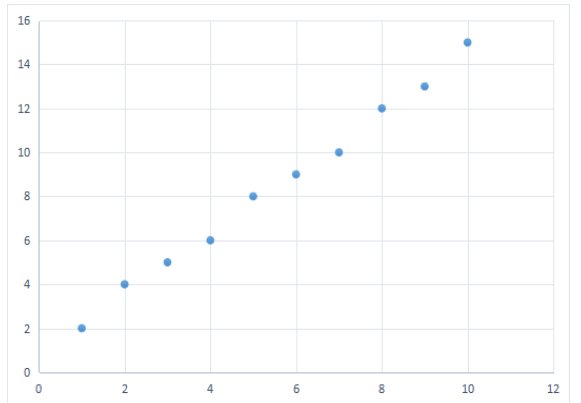
The scatter plot of this data would most likely show a:
Options
A
Positive correlation
B
Negative correlation
C
No correlation
D
Non-linear correlation
Answer & Analysis
Click "Show Answer" to reveal the answer and analysis
Want More Practice Questions?
Access thousands of practice questions with detailed explanations on Scholardog.
Practice Now - It's Free!