Question #6421430Single Choice
Algebra-1
Question
The table shows the distribution of ages of employees in a company. The company decides to group the data into intervals of 10 years starting from 20 - 30.
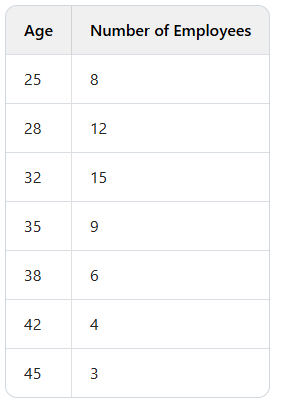
What is the frequency of the 30 - 40 age interval?
Options
A
15
B
24
C
30
D
38
Answer & Analysis
Click "Show Answer" to reveal the answer and analysis
Want More Practice Questions?
Access thousands of practice questions with detailed explanations on Scholardog.
Practice Now - It's Free!