Question #6421396Single Choice
Algebra-1
Question
The table shows the number of defective products in different batches.
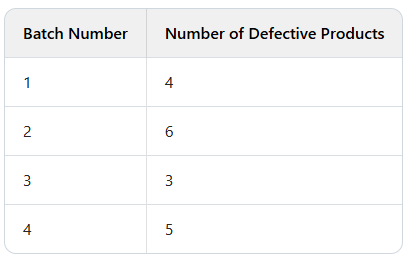
If a histogram is drawn to represent this data, which batch will have a bar with a height corresponding to 6?
Options
A
Batch 1
B
Batch 2
C
Batch 3
D
Batch 4
Answer & Analysis
Want More Practice Questions?
Access thousands of practice questions with detailed explanations on Scholardog.
Practice Now - It's Free!