Question #6421392Single Choice
Algebra-1
Question
The table shows the number of emails received by an office in different time periods.
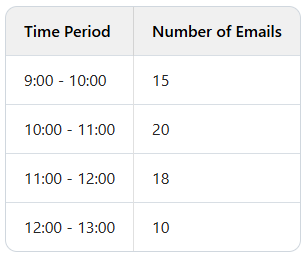
If we create a histogram and label the x-axis with the time periods and the y-axis with the number of emails, what will be the shape of the histogram if we connect the midpoints of the tops of the bars?
Options
A
A straight line
B
A curve that increases then decreases
C
A curve that decreases then increases
D
A series of steps
Answer & Analysis
Click "Show Answer" to reveal the answer and analysis
Want More Practice Questions?
Access thousands of practice questions with detailed explanations on Scholardog.
Practice Now - It's Free!