Question #6421362Single Choice
Algebra-1
Question
The histogram below represents the exam scores (out of 100) of a group of students. Each interval has a width of 10 points.
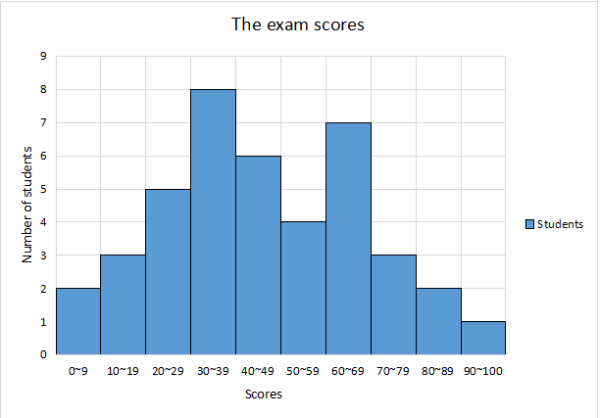
How many students scored between 70 and 79?
Options
A
3
B
8
C
10
D
12
Answer & Analysis
Want More Practice Questions?
Access thousands of practice questions with detailed explanations on Scholardog.
Practice Now - It's Free!