Question #6421336Single Choice
Algebra-1
Question
The histogram below represents the exam scores (out of 100) of a group of students. Each interval has a width of 10 points.
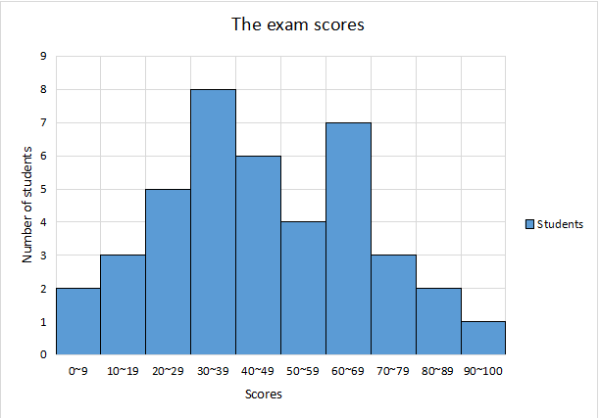
How many students scored below 50?
Options
A
16
B
18
C
22
D
24
Answer & Analysis
Click "Show Answer" to reveal the answer and analysis
Want More Practice Questions?
Access thousands of practice questions with detailed explanations on Scholardog.
Practice Now - It's Free!