Question #6421325Single Choice
Algebra-1
Question
The histogram below represents the exam scores (out of 100) of a group of students. Each interval has a width of 10 points.
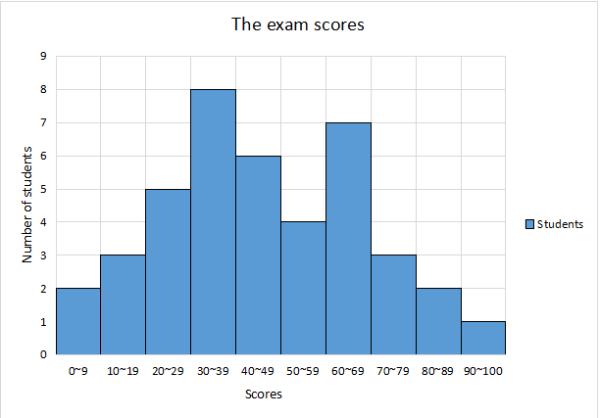
What is the range of the exam scores?
Options
A
100
B
98
C
90
D
80