Question #6421225Single Choice
Algebra-1
Question
The line plot below shows the number of tests taken by students over the past semester. Each dot represents one student.
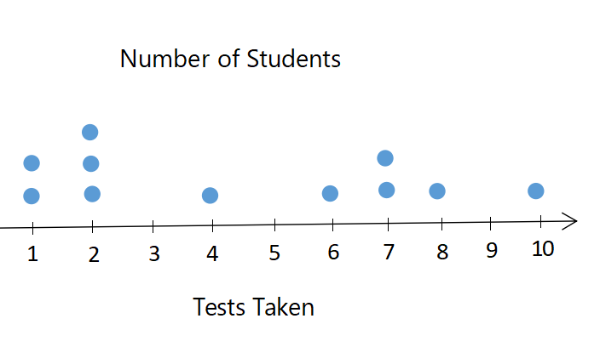
If two students are added: one who took 0 tests and another who took 15 tests, what is the new range?
Options
A
16
B
15
C
14
D
13
Answer & Analysis
Click "Show Answer" to reveal the answer and analysis
Want More Practice Questions?
Access thousands of practice questions with detailed explanations on Scholardog.
Practice Now - It's Free!