Question #6421219Single Choice
Algebra-1
Question
The line plot below shows the number of math problems solved by a group of students. Each dot represents one student.
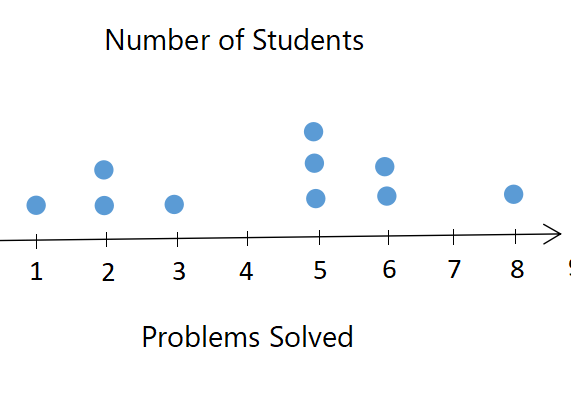
What happens to the range if one student solves 50 problems?
Options
A
The range increases by 50.
B
The range increases by 42.
C
The range increases by 47.
D
The range stays the same.