Question #6421205Single Choice
Algebra-1
Question
The line plot below shows the number of science experiments completed by students in a semester. Each dot represents one student.
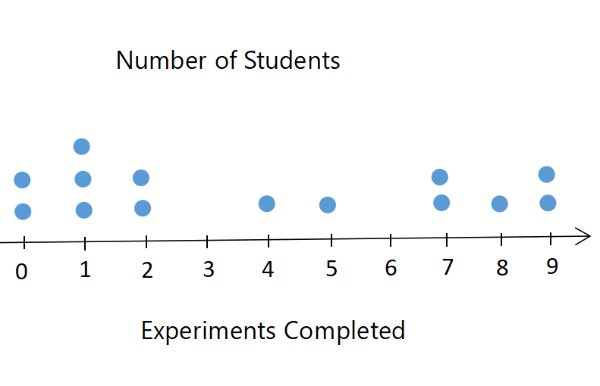
If the range is correctly calculated, which of the following adjustments would change the range value?
Options
A
Adding a student who completed 6 experiments.
B
Adding a student who completed 3 experiments.
C
Adding a student who completed 0 experiments.
D
Adding a student who completed 10 experiments.