Question #6421199Single Choice
Algebra-1
Question
The following line plot shows the number of classes missed by students in a semester. Each dot represents one student.
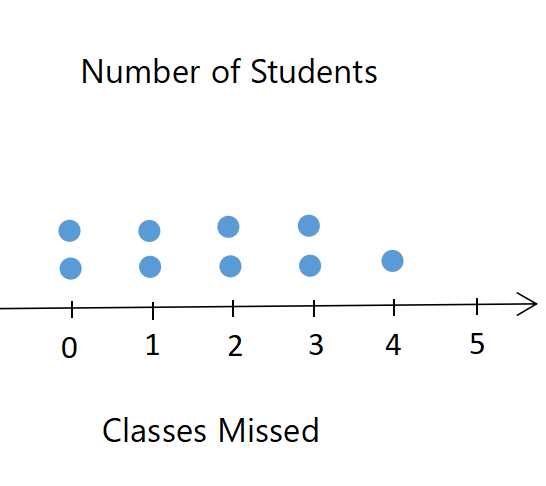
Which of the following is true about the data in the line plot?
Options
A
The range is 5.
B
The mode is 0.
C
The minimum value is 1.
D
The maximum value is 4.