Question #6421198Single Choice
Algebra-1
Question
The line plot below shows the number of math problems solved by students in a study group. Each dot represents one student.
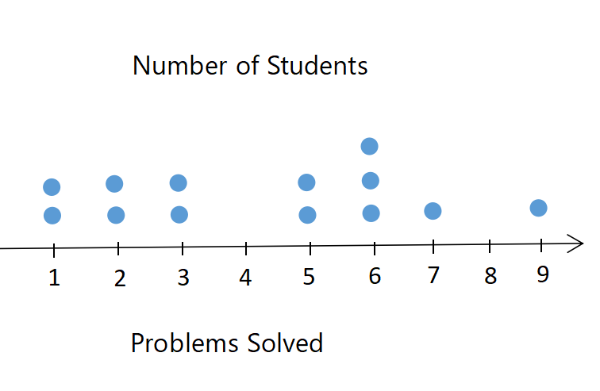
What is the range of the number of math problems solved?
Options
A
5
B
6
C
8
D
9