Question #6421127Single Choice
Algebra-1
Question
The following dot plot shows the number of candies collected by children during Halloween.
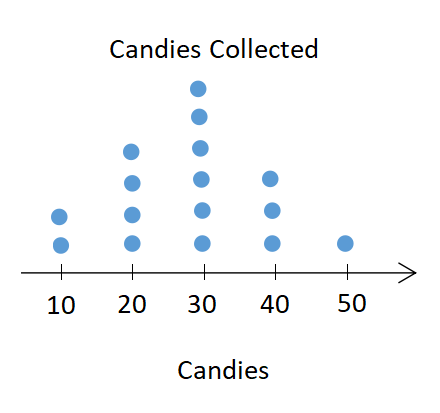
What is the range of the candies collected?
Options
A
20
B
30
C
40
D
50
The following dot plot shows the number of candies collected by children during Halloween.
What is the range of the candies collected?