Question #6421112Single Choice
Algebra-1
Question
The following dot plot shows the number of hours students studied for a test.
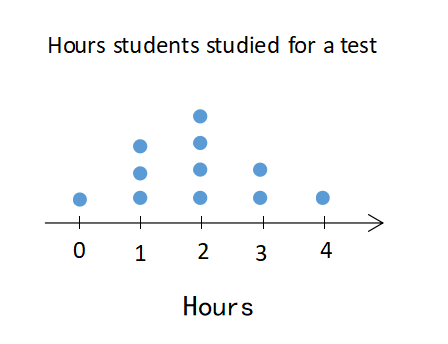
What is the range of hours studied by any student?
Options
A
0
B
2
C
3
D
4
The following dot plot shows the number of hours students studied for a test.
What is the range of hours studied by any student?