Question #6421105Single Choice
Algebra-1
Question
The following dot plot shows the number of books read by students during a semester.
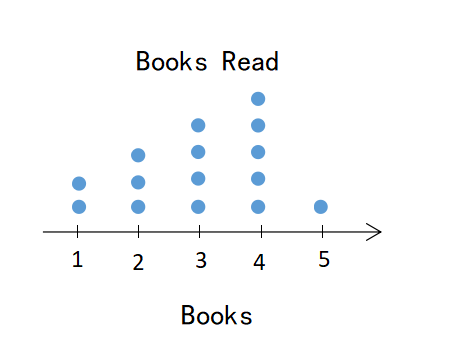
What is the range of books read by any student?
Options
A
1
B
2
C
4
D
5
The following dot plot shows the number of books read by students during a semester.
What is the range of books read by any student?