Which of the following graphs is most likely the graph of the function ?
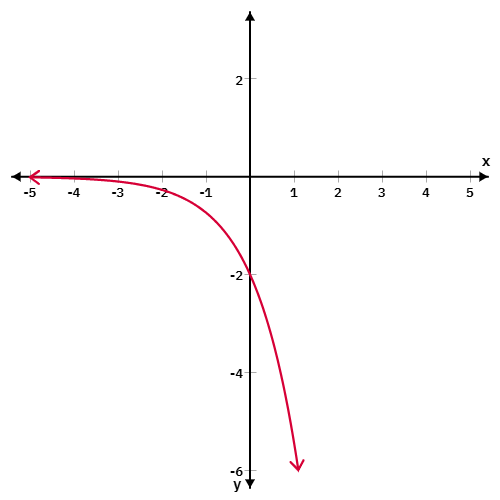
Option D is most likely the graph of the function .
The function , we have -2<0. So the function is a decreasing function.
When x = 0, we substitute x = 0 into the function . Using the property that , we get . So the y- intercept of the function is (0, -2).
As , , Click "Show Answer" to reveal the answer and analysis
Click "Show Answer" to reveal the answer and analysis
Access thousands of practice questions with detailed explanations on Scholardog.