What is the graph of the function ?
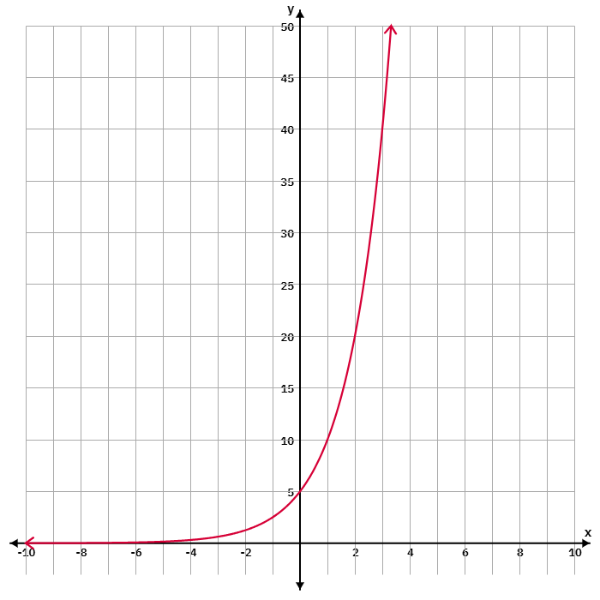
The graph of the function is option A.
is an exponential function of the form , where a = 5 and b = 2.
For exponential functions with b>1, the graph will be an increasing curve.
When , . So, the y-intercept is at the point (0, 5).
As x becomes more negative, Click "Show Answer" to reveal the answer and analysis
Click "Show Answer" to reveal the answer and analysis
Access thousands of practice questions with detailed explanations on Scholardog.