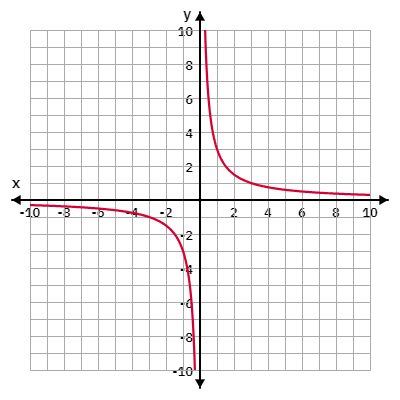
The graph is a hyperbola with two branches that approach but never reach the x and y axes, and it is symmetric. As one variable increases, the other decreases.
Inverse variation is characterized by the equation
Want More Practice Questions?
Access thousands of practice questions with detailed explanations on Scholardog.