Question #6415189Single Choice
Algebra-2
Question
Which of the following graphs represents the function f(x) = |x - 6| + 3?
Options
A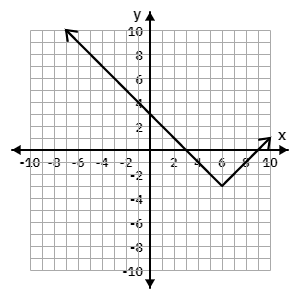
B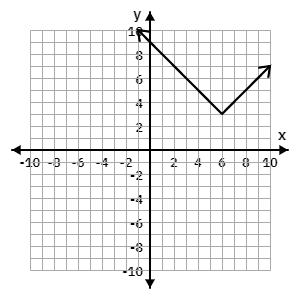
C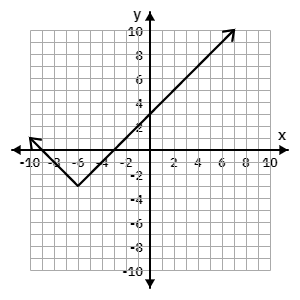
D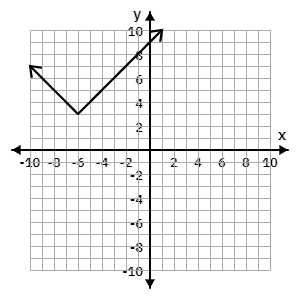
Answer & Analysis
Click "Show Answer" to reveal the answer and analysis
Want More Practice Questions?
Access thousands of practice questions with detailed explanations on Scholardog.
Practice Now - It's Free!