Question #6414821Single Choice

Algebra-2

Question

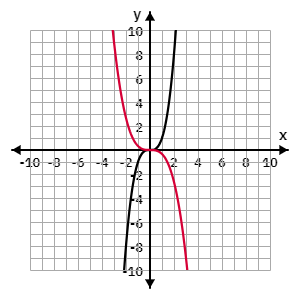
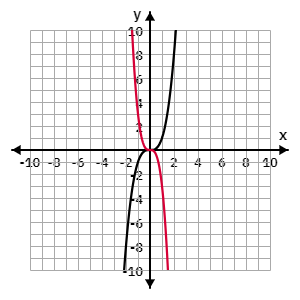
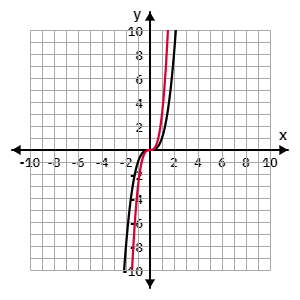
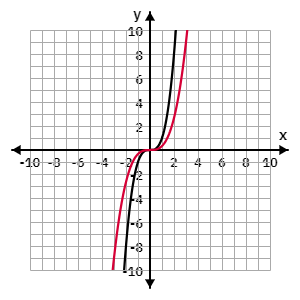
The graph of   is shown below. Which of the following graphs shows the function after a vertical compression by a factor of  , resulting in  ?

Options

A
https://img.scholardog.com/ess-files/sat-bms-web/fiex/couser/2024/10/13/374EA1468A1D4B288C64FECB9D94C391.png
B
https://img.scholardog.com/ess-files/sat-bms-web/fiex/couser/2024/10/13/6CB2AA3D9C194C8D902917E4721C3A71.png
C
https://img.scholardog.com/ess-files/sat-bms-web/fiex/couser/2024/10/13/9C04DB3836A0407286F8F2160326A79F.png
D
https://img.scholardog.com/ess-files/sat-bms-web/fiex/couser/2024/10/13/53A253DF82774B95888B0AD75882295B.png

Answer & Analysis