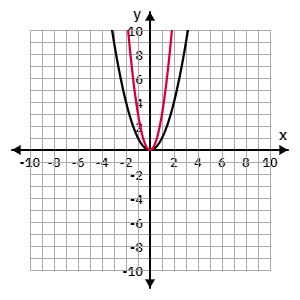
The graph of is shown below (standard parabola). The function is vertically stretched by a factor of 3. Which of the following graphs represents the new function ?
Options
A
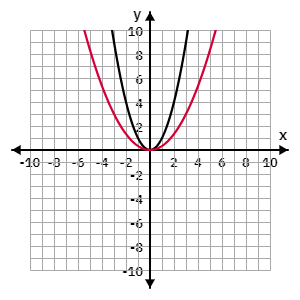
B
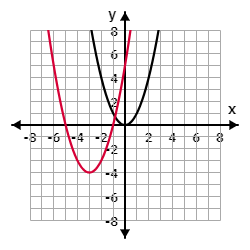
C
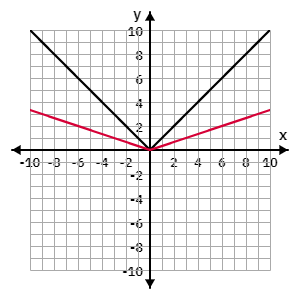
D
Answer & Analysis
Answer
A
Analysis
The vertical stretch by a factor of 3 makes the parabola narrower.
Every point on the graph of
Want More Practice Questions?
Access thousands of practice questions with detailed explanations on Scholardog.