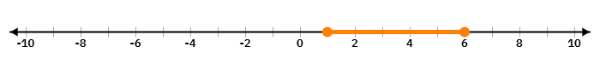
To determine which inequality is
represented by the given number line, we need to carefully analyze the shaded
regions and the endpoints of those regions.
When interpreting a number line, typically
a solid dot represents the inclusion of that value (i.e., it is equal to and
satisfies the inequality), while an open dot represents the exclusion of that
value (i.e., it is not equal to and does not satisfy the inequality). The colored
line represents the region where the inequality holds true.
Click "Show Answer" to reveal the answer and analysis