To determine which graph represents “x is
great than 4”, we need to understand what this inequality means and how it is
represented on a number line.
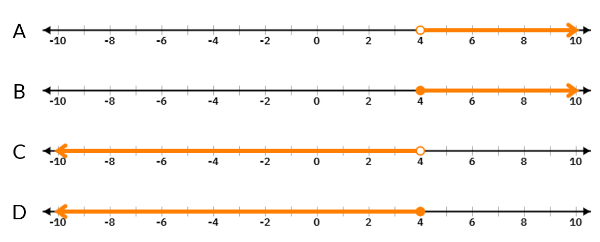
“x is great than 4” can be represented as x
> 4. It means that x includes all numbers greater than 4, but not 4 itself.
On a number line, this is represented by: A line with an open circle at 4 and
shading to the right.
To compare the given graphs:
Graph A
There is an open circle at 4 and the
shading extends to the right.
This represents x > 4, as it includes
all numbers greater than 4 but not 4 itself.
Graph B
There is a closed circle at 4 and the
shading extends to the right.