To determine which graph represents the
inequality -6 ≤ x ≤ 8, we need to understand what
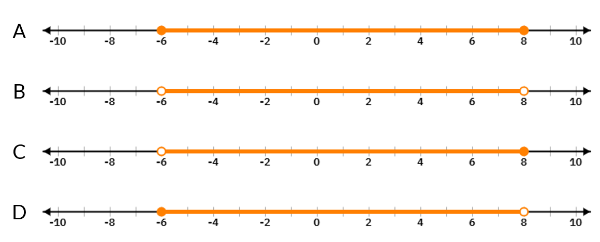
this inequality means and how it is represented on a number line.
-6 ≤ x ≤ 8 means that x must be
between -6 and 8,
including both endpoints. On a number line, this is represented by: A line
segment starting at -6 and ending at 8, with closed circles at both -6 and 8 to indicate
that these endpoints are included.
To compare the given graphs:
Graph A
The graph shows a range between -6 and 8,
with closed circles at both -6 and 8. This indicates that x can be any number from -6 and 8, inclusive of both
-6 and 8.
This graph represents -6 ≤ x ≤ 8.
Graph B
The graph shows a range between -6 and 8,
with open circles at both -6 and 8. This indicates that x can be any number from -6 and 8, excluding both...