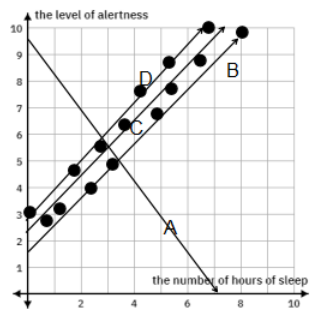
To determine which line best represents the line of best fit for the scatter plot, let’s analyze the options in the context of the scatter plot where data points trend from the lower left to the upper right (an upward trend):
Characteristics of the Line of Best Fit
1. Trend Representation: The line of best fit should follow the overall trend of the data points.
2. Minimizes Distance: It should minimize the distance between itself and most of the data points.
3. Direction: Given that the data points trend upward from left to right, the line of best fit should also be upward-sloping.
Analysis of Each Line Option
Line A: Since the data points trend upward from left to right, a downward-sloping line does not represent the trend of the data. Therefore, Line A cannot be the line of best fit.