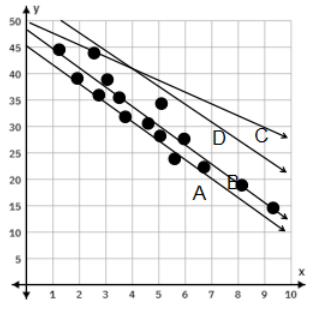
To determine which line represents the line of best fit in the scatter plot, let's analyze each option based on the properties of a line of best fit:
Characteristics of a Line of Best Fit
1. Trend Representation: The line of best fit captures the general trend of the data points.
2. Minimizes Errors: It minimizes the overall distance between the line and all data points.
3. Not Necessarily Passing Through All Points: It does not have to pass through every point but should be as close as possible to most points.
Analysis of Each Line Option
Line A: While this line aligns with some data points, it doesn't fit all points closely. It may represent part of the trend but is not the best fit overall if it doesn't closely follow most points.
Line B: This line is the most accurate representation of the trend in the data. It clos...