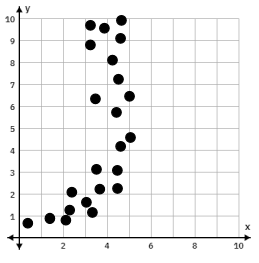
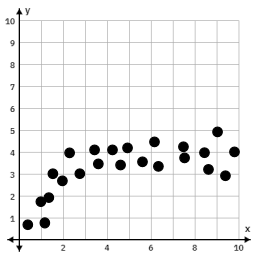
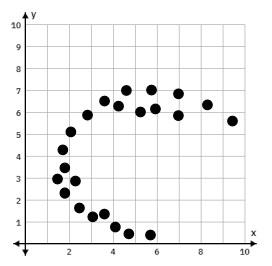
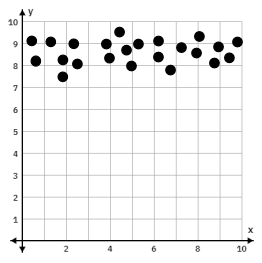
Which scatter plot shows a linear relationship between x and y?
Based on the graphs:
Graph A: Shows a vertical rise, indicating a non-linear relationship.
Graph B: Data points rise and then level off, suggesting a curve.
Graph C: Data points form a half-circle, indicating a non-linear relationship.
Click "Show Answer" to reveal the answer and analysis
Access thousands of practice questions with detailed explanations on Scholardog.