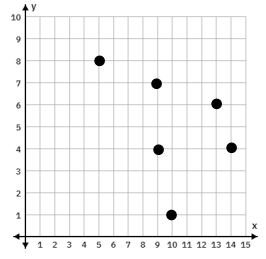
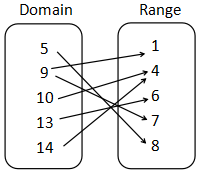
Based on the points on the graph: (5,8) (9,4) (9,7) (10,1) (13,6) (14,4), let's evaluate each option to find the correct mapping diagram:
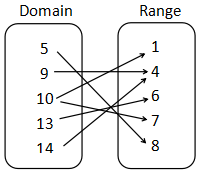
A incorrectly maps (10,7) instead of (9,7). This makes Option A incorrect because it does not accurately represent all the given points.
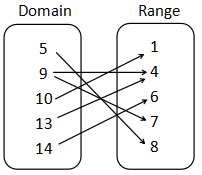
B incorrectly maps (13,4) instead of (13,6).
And incorrectly maps (14,6) instead of (14,4).
These make Option B incorrect because it does not accurately represent all the given points.
Click "Show Answer" to reveal the answer and analysis