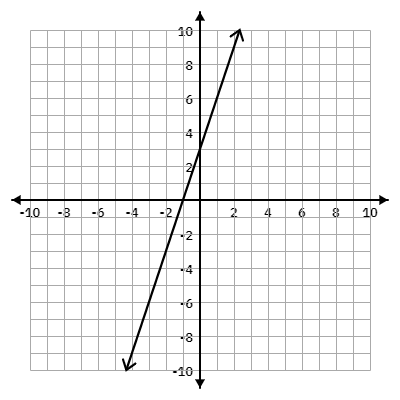
Among the options provided, the graph that does not show a nonlinear function is: B.
Here's the reasoning:
A linear function is characterized by a constant rate of change between variables, meaning the relationship between the variables forms a straight line when plotted on a graph.
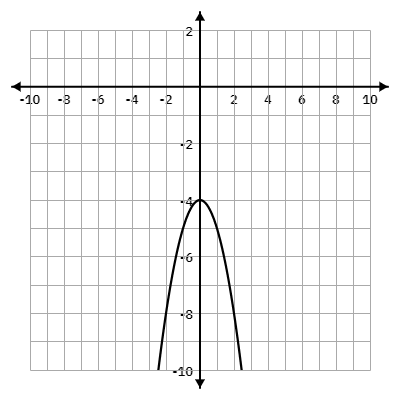
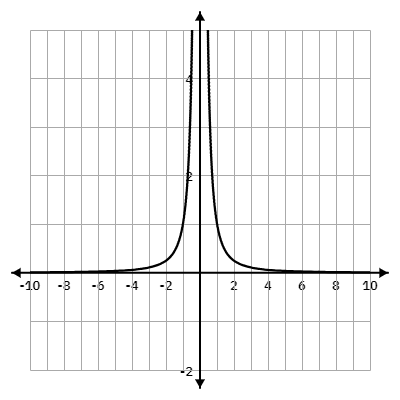
In contrast, a non-linear function does not result in a straight line graph; instead, it can have curves, bends, or other shapes.
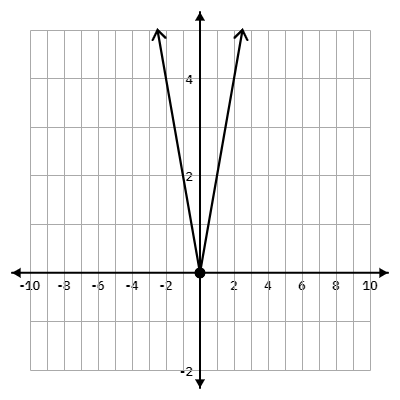
A. The graph describes a piecewise linear function.
When x is less than zero, the graph is a straight line sloping downwards from left to right. This segment represents a linear function with a negative slope.
When x is greater than zero, the graph is a straight line sloping upwards fr...