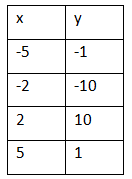
Let's analyze the given table to determine if it represents a linear function, a nonlinear function, or if it's not a function at all.
Functionality check:
Each value of x corresponds to a unique value of y, and there are no repeated x values with different y values. Therefore, the table represents a function.
Linearity check:
For a function to be linear, the change in y for a constant change in x (slope) should be consistent throughout the table.
Calculate the slope between pairs of points to check for consistency:
From x=−5 to x=−2:
From x=−2 to x=2: