To determine whether the given table represents a linear function, a nonlinear function, or is not a function at all, we need to check the consistency of the relationship between x and y.
First, check if it represents a function:
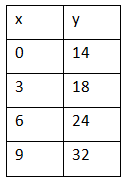
A function requires that each input (x-value) maps to exactly one output (y-value). In this case, no x-value is repeated, and each has only one y-value. Thus, it is a function.
Then, calculate the differences in y for consecutive values of x:
From x = 0 to x = 3: y changes from 14 to 18. The change is 18 − 14 = 4.
From x = 3 to x = 6: y changes from 18 to 24. The change is 24 − 18 = 6.
Click "Show Answer" to reveal the answer and analysis