Question #6409090Single Choice
Algebra-1
Question
The snail are very slow, about 0.004 meters per minute, which of the following graphs can indicate the crawling speed of the snail?
Options
A 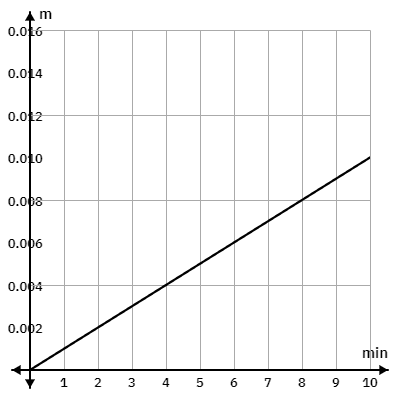
B 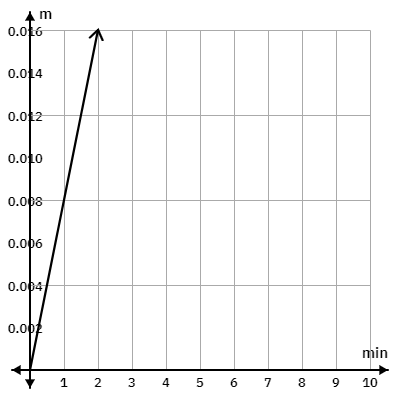
C 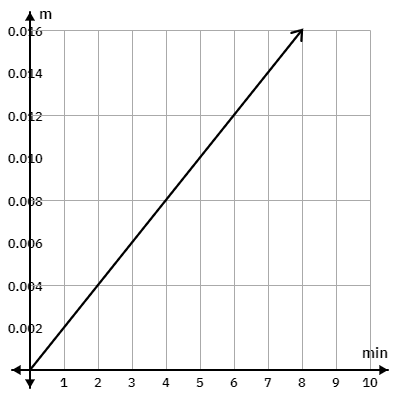
D 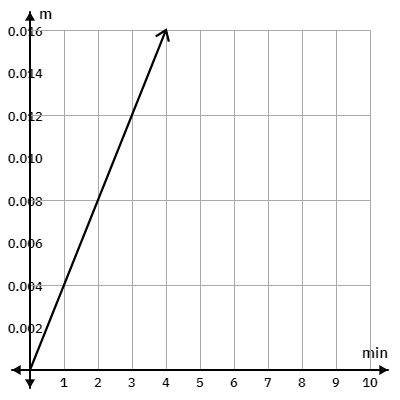
The snail are very slow, about 0.004 meters per minute, which of the following graphs can indicate the crawling speed of the snail?