To determine if the function is linear from its graph, we need to understand the characteristics of a linear function:
1. Straight Line: A linear function will always produce a straight line when graphed on a Cartesian plane.
2. Constant Rate of Change: A linear function has a constant rate of change (slope). This means that as x increases by a certain amount, y changes by a consistent amount determined by the slope m.
Let's analyze the given options in light of these characteristics:
A: "This is a linear function because it does not have a constant rate of change" - This is incorrect. Linear functions by definition have a constant rate of change (slope).
B: "This is a linear function because it creates a curved line" - This is incorrect. Linear functions always produce straight lines, not curved lines.
C: "This is a linear function because it have a constant rate of change" - This is correct. This function has a constant rate of change (slope).
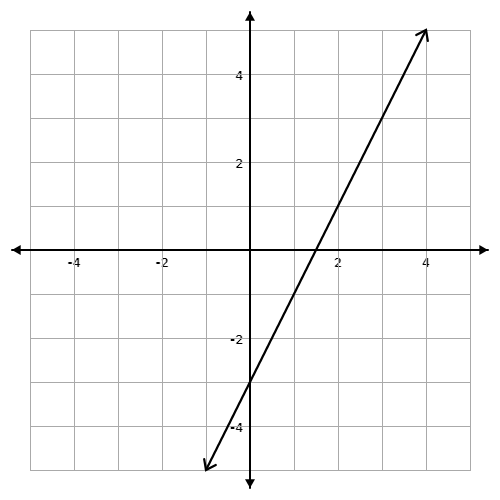
Let's calculate the rate of change in y to change in x for some data points on the graph:(-1, -5) (0, -3) (1, -1) ( 3, 3).
Calculate the corresponding differences in y:
Calculate the corresponding differences in x: