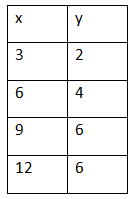
To determine whether the given function is linear or nonlinear, we can examine the relationship between the input variable (x) and the output variable (y) based on the provided data points.
If a function is linear, the output variable (y) will be directly proportional to the input variable (x), meaning that the ratio of change in y to change in x will be constant.
Let's calculate the ratios of change in y to change in x for the given data points:
Change in y for the first data point:4 -2 = 2
Change in x for the first data point: 6 - 3 = 3
Ratio of change in y to change in x for the first data point:
Change in y for the second data point: 6 - 2 = 2
Change in x for the second data point: 9 - 6 = 3
Ratio of change in y to change in x for the second data point: