Analysis
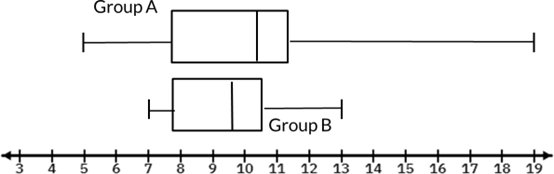
In this image, we can see the data distributions of two groups (Group A and Group B) on a number line. Dispersion refers to the extent of spread or variability in the data distribution. In other words, it describes how the data points are spread around a central value, typically the mean or median. Typically, dispersion can be measured using statistics such as range (the difference between the maximum and minimum values), variance, or standard deviation.
In this case, we can compare the dispersion of the two groups by observing the distribution of data points on the number line:
Click "Show Answer" to reveal the answer and analysis