Analysis
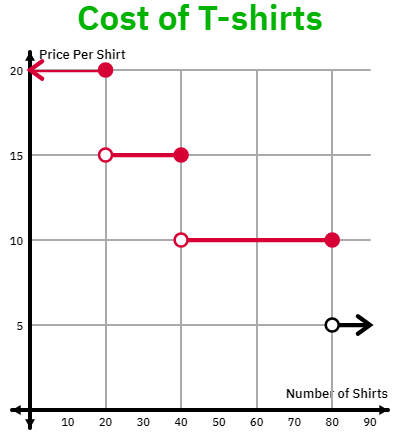
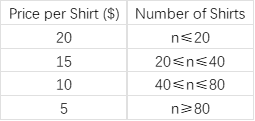
The image is a line graph depicting the cost of T-shirts. The horizontal axis represents the quantity of T-shirts, while the vertical axis represents the price per T-shirt. Based on the data points in the graph, we can observe the following:
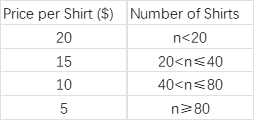
1. When the quantity of T-shirts is less than or equal to 20, the price per T-shirt is $20.
2. When the quantity of T-shirts exceeds 20 but is less than or equal to 40, the price per T-shirt is $15.
3. When the quantity of T-shirts exceeds 40 but is less than or equal to 80, the price per T-shirt is $10.
4. When the quantity of T-shirts exceeds 80, the price per T-shirt is $5.
Now let's compare the options:
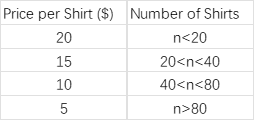
Option A: It represents the prices for the quantity ranges 20<n<...
Click "Show Answer" to reveal the answer and analysis