Analysis
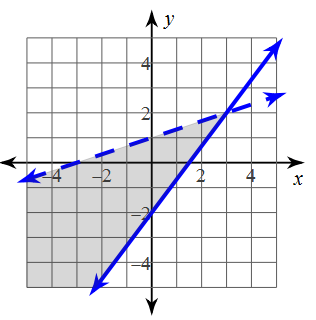
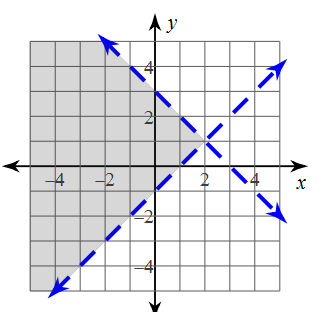
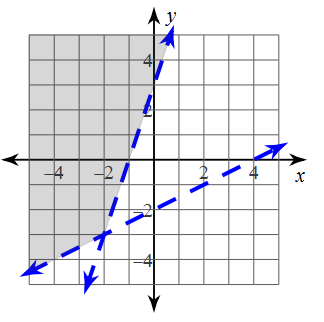
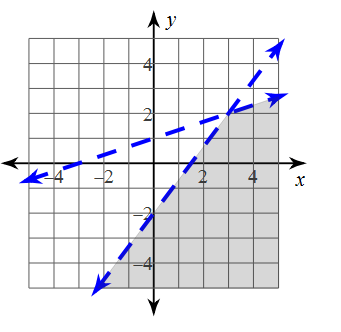
The characteristics of the graph for the given system of inequalities, y < -x + 3 and y > x - 1, are as follows:
1. The graph represents a region in the coordinate plane.
2. The region is bounded by two lines.
3. The line y = -x + 3 represents a downward-sloping straight line passing through the point (0, 3).
4. The line y = x - 1 represents an upward-sloping straight line passing through the point (0, -1).
5. The inequality y < -x + 3 indicates that the region below the line y = -x + 3 is included in the solution set. The line itself is not included in the solution set, so it is typically drawn as a dashed line.
6. The inequality y > x - 1 indicates that the region above the line y = x - 1 is included in the solution set. The line itself is in...
Click "Show Answer" to reveal the answer and analysis