Question #6402827Single Choice
Math
Question
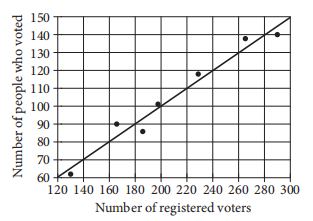
The scatterplot above shows the number of registered voters, x, and the number of people who voted in the last election, y, for seven districts in a town. A line of best fit for the data is also shown. Which of the following could be the equation of the line of best fit?
Options
A
B
C
D
Answer & Analysis
Click "Show Answer" to reveal the answer and analysis
Want More Practice Questions?
Access thousands of practice questions with detailed explanations on Scholardog.
Practice Now - It's Free!