Question #6402786Single Choice
Math
Question
Jake buys a bag of popcorn at a movie theater. He eats half of the popcorn during the 15 minutes of previews. After eating half of the popcorn, he stops eating for the next 30 minutes. Then he gradually eats the popcorn until he accidentally spills all of the remaining popcorn. Which of the following graphs could represent the situation?
Options
A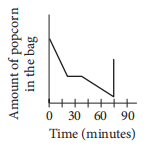
B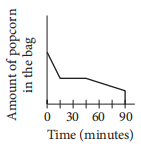
C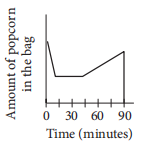
D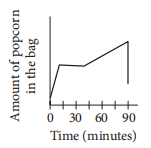
Answer & Analysis
Click "Show Answer" to reveal the answer and analysis
Want More Practice Questions?
Access thousands of practice questions with detailed explanations on Scholardog.
Practice Now - It's Free!