Question #6402755Single Choice
Math
Question
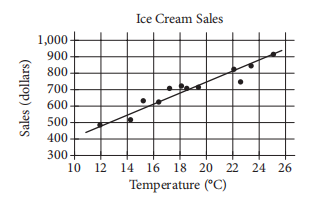
The scatterplot above shows a company’s ice cream sales d, in dollars, and the high temperature t, in degrees Celsius (°C), on 12 different days. A line of best fit for the data is also shown. Which of the following could be an equation of the line of best fit?
Options
A
B
C
D
Answer & Analysis
Click "Show Answer" to reveal the answer and analysis
Want More Practice Questions?
Access thousands of practice questions with detailed explanations on Scholardog.
Practice Now - It's Free!